Apps & Tools
Convert your already-synthesized sheet to a mental model skyline, using one of these tools.
In the works: a tool to help either find interior cognition concepts in a transcript, or summarize the concepts, or both.
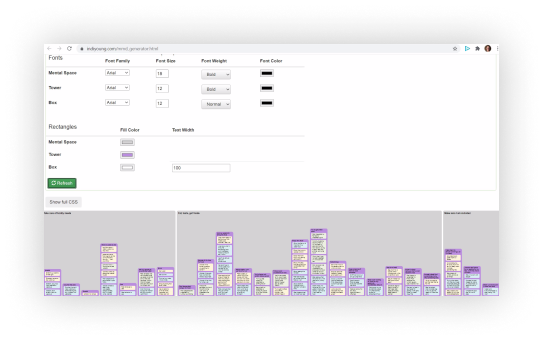
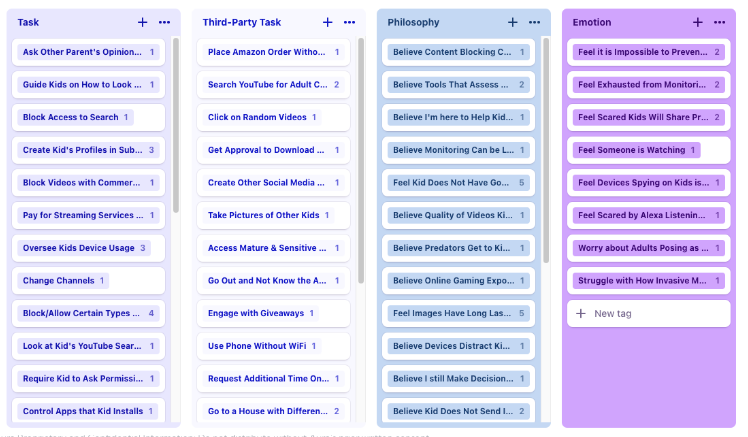
Indi’s Mental Model Dataset Visualizer
Created by Indi Young
This dataset visualizer reads your spreadsheet and outputs it as a diagram. The simple browser-based interface allows you to set a limited set of fonts, sizes, and colors. You can export it as an SVG or PNG file, which you can load into a drawing tool like illustrator or a collaboration tool like Mural.
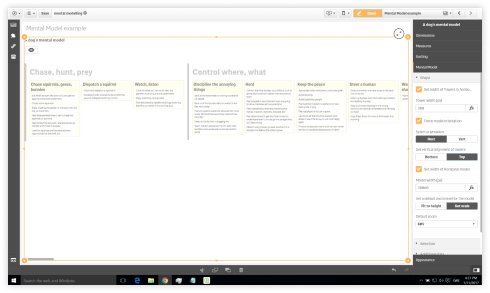
Qlik Sense for visualizing nested dimensions
Created by Murray Grigo-McMahon
This is an extension for Qlik Sense that creates visualisations whenever you need to show nested dimensions. It was designed with mental model diagrams in mind, with the ability to move up and down in the levels of data and see other views.
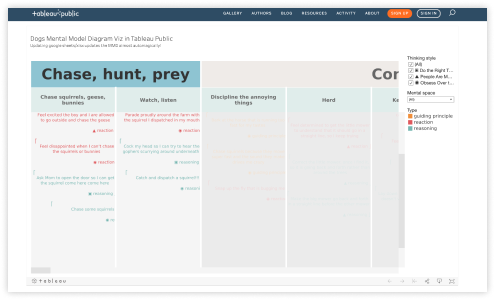
Tableau: Example using the dog mental model
Created by Guillermo Ermel
You can explore the dog cognition data by mental space and by thinking style. Download the same dog cognition dataset here: Eat, Smell, Prey. Or if you’re into cats: Nap, Listen, Pounce
Dovetail Ideas and Workarounds
Created by Kyle Bowen and Kristi Leach
Two-level nesting is possible in Dovetail, as is drawing groups on the Insight Canvas to built towers. Read some suggestions and experiment.
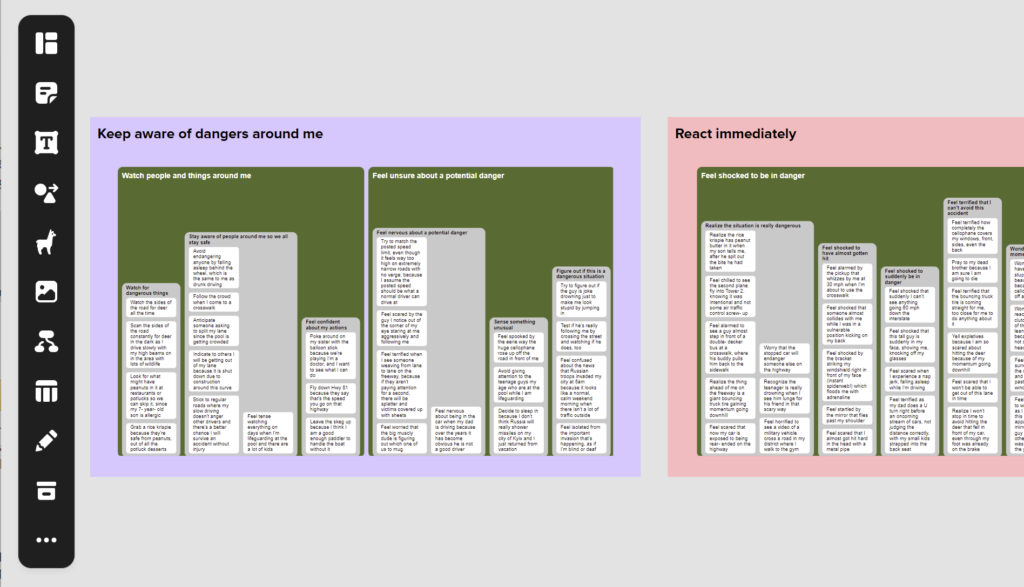
Mural and Miro
Both platforms allow you to create stickies & boxes and arrange them how you want. If your dataset is small, this manual approach is a viable option. For large datasets, use Indi’s App to create the svg image, and import into these platforms to layer data below and on top.
Mural: TBA Indi is hoping to use their API to output native objects from her own app that reads the spreadsheet.
Miro: This is the opposite of how we usually work, but … Mappl.io lets you convert stickies to tables and then export to CSV.
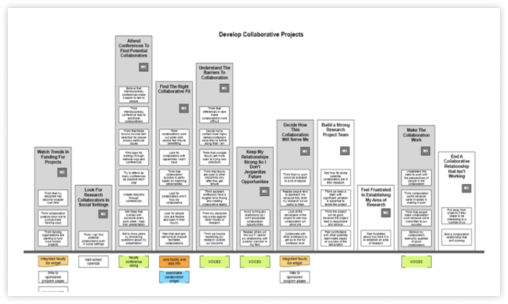
OmniGraffle: Using OmniOutliner to Create Your MMD
Created by Voltaire Santos Miran
Are you an OmniGraffle fan? There’s an add-on! You can create one Outliner document for each interview. Then create summaries and the whole diagram from there. This includes Voltaire’s summaries template.
Coda.io
Suggested by Kyle Bowen
Kyle: I rely pretty heavily on Coda.io for problem-spacey projects. On the surface, Coda looks like a doc solution, but it does some pretty amazing stuff with databases.