
Mural Mental Model Skyline Generator
How to access the app
The Mural Mental Model Skyline Generator is available free of charge to current students in Indi’s courses. Please log in to your account, then refresh this page to start using the generator.
Just want access to the app? Purchase access here.
View the Privacy Policy here for information about how the app handles your data.
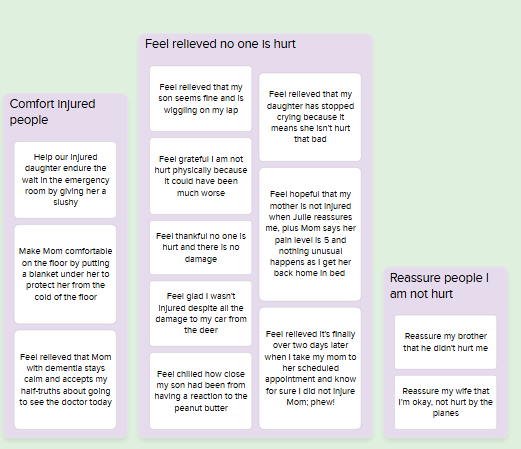
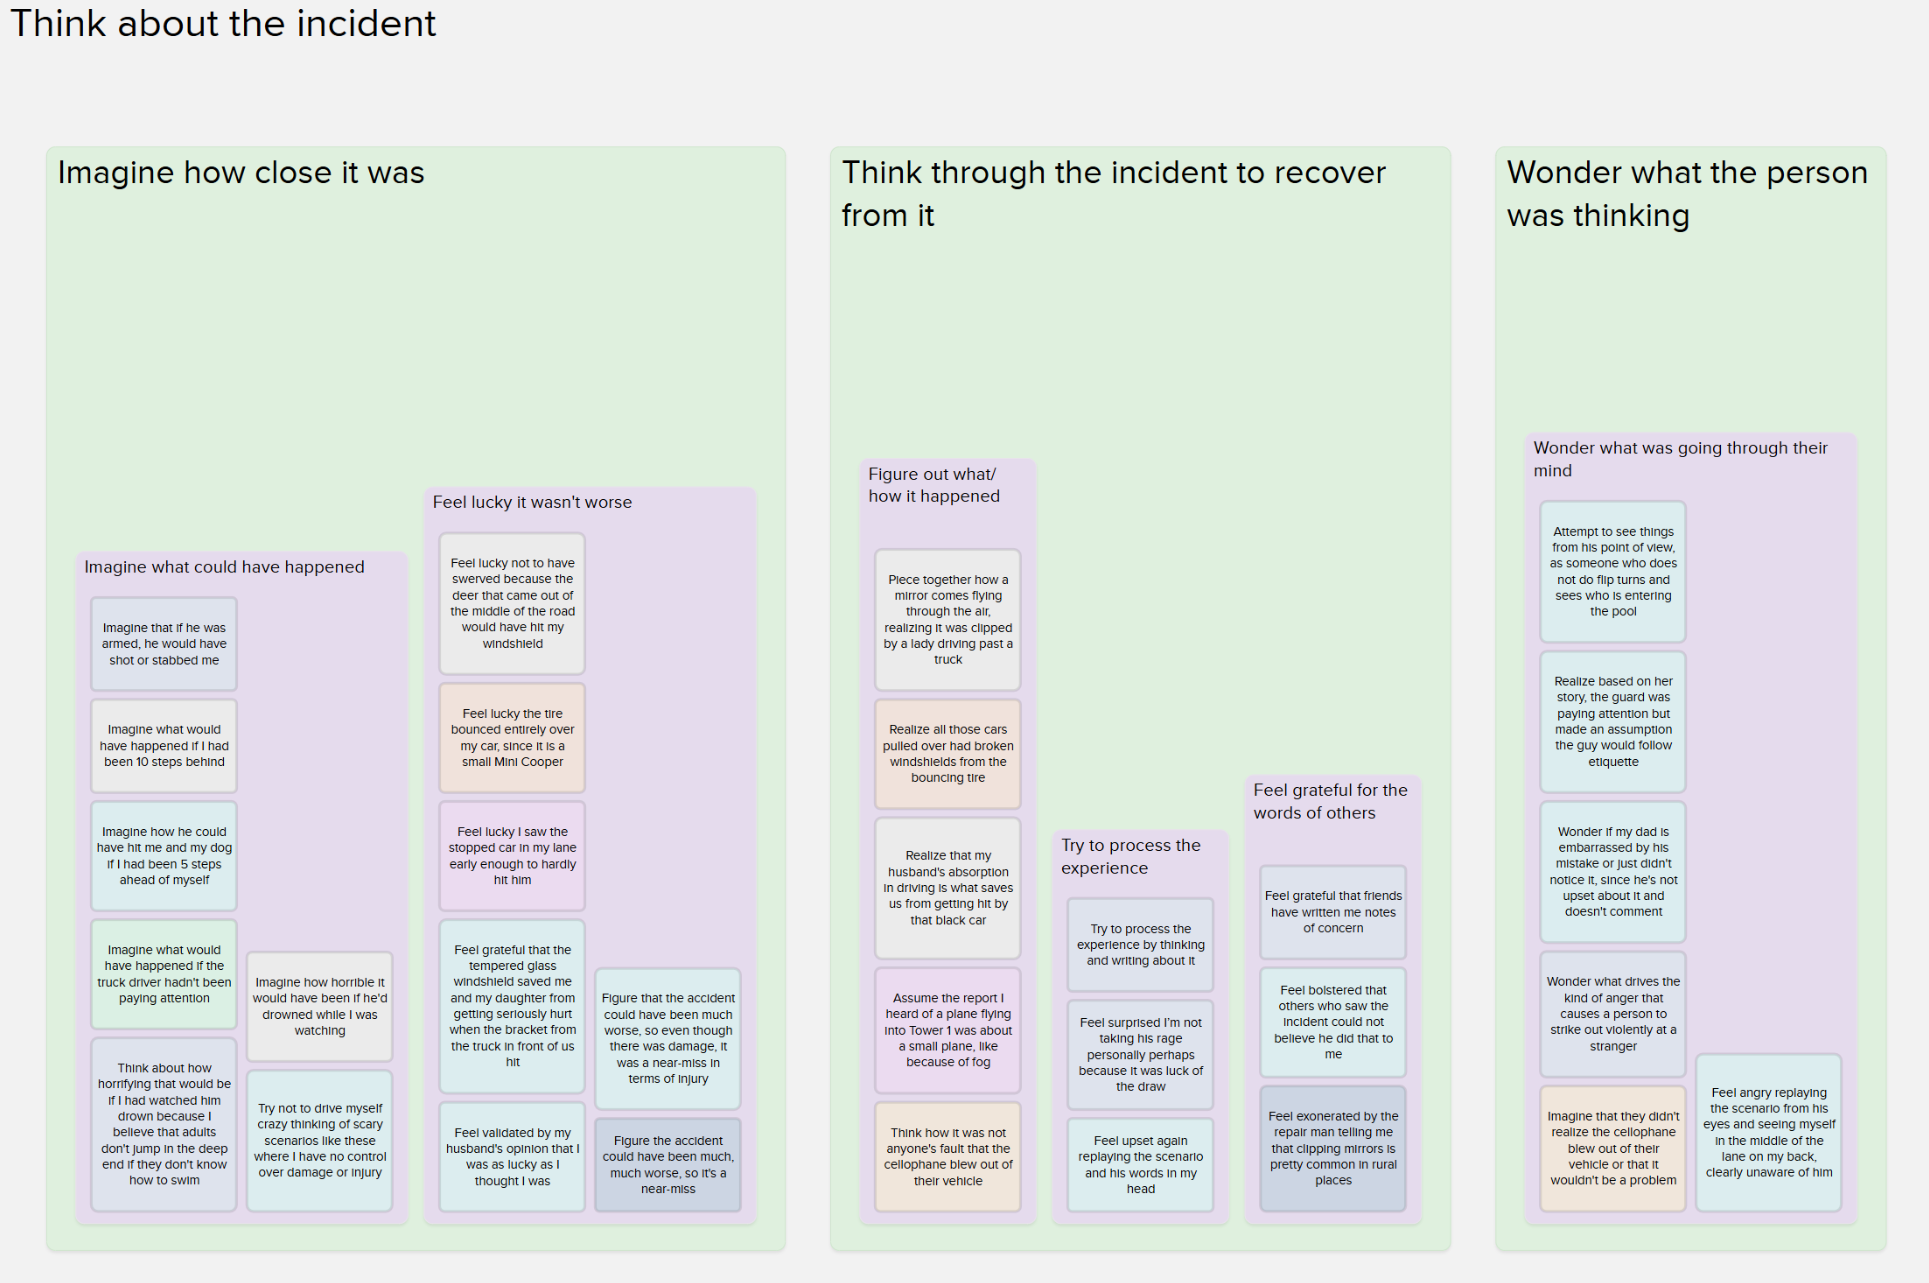 AFTER
AFTER
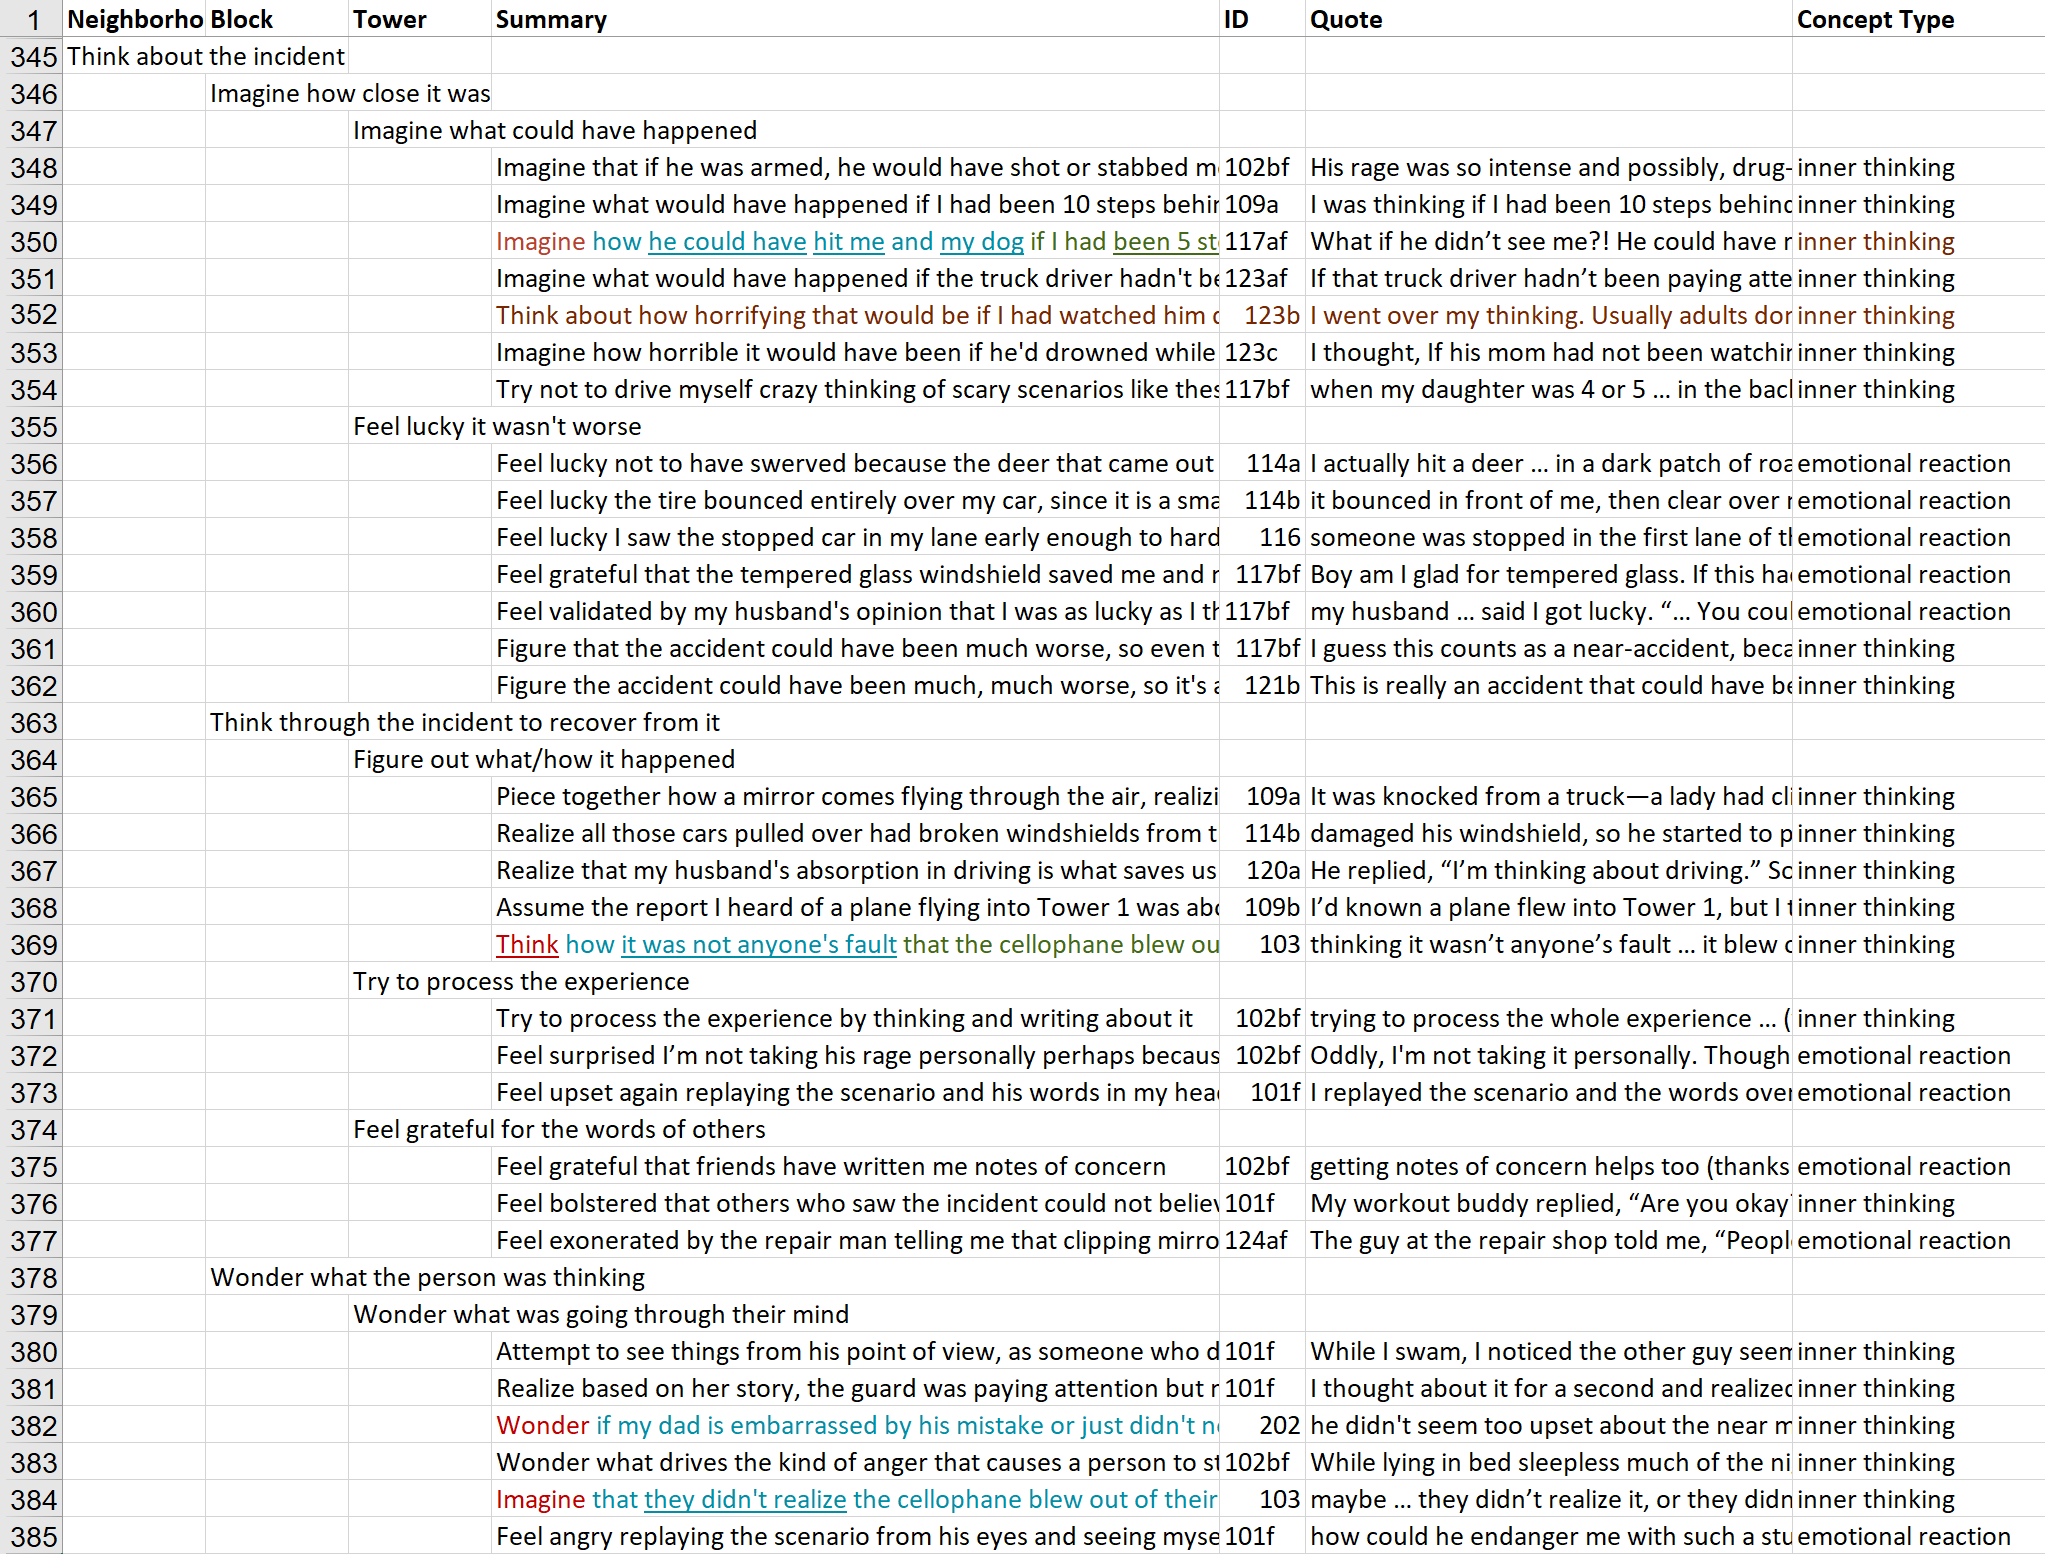 BEFORE
How to use the Mural Mental Model Skyline Generator app
Table of Contents
- Getting Started
- Select a Workspace and Room
- Pick a Mural board (or create one)
- Generate your Skyline
- Data Privacy
- Terms of Use
1. Getting Started
To start generating Mental Model Skylines with this app, first click the “Connect to Mural” button and follow the prompts to log in to your Mural account.
The first time you go through the login process, you’ll see a request from the app for permission to access certain aspects of your Mural account. The app uses these permissions to:
- get a list of Mural Workspaces you have access to
- get a list of Mural Rooms within those workspaces
- get a list of Murals within the Rooms that you have access to
- read and write data to/from Mural boards that you have access to
No information about your Mural account is saved on the indiyoung.com server. See the Privacy section below for more about how we handle your data.
2. Select a Workspace and Room to work in
Once you’ve logged in to your Mural account and authorized the app, you’ll be redirected back to this page, and the “Workspaces” dropdown will display the Mural Workspaces you have access to.
When you select a Workspace from the list, the Rooms dropdown will populate with a list of the Rooms available in that Workspace.
Select a Room from that dropdown to see the available Mural boards in that Room. If no Mural boards exist in the Room, you can use the “Create New Mural” button to create one (assuming you have permission to create Murals in the selected Room).
3. Pick a Mural board (or create one)
You should now see a list of the current Mural boards that exist in your selected Room. To use an existing Mural board, click “Generate Skyline Here” below the Mural’s image; this opens the Skyline Builder interface.
If no Mural boards exist in your selected room, you can use the “Create New Mural” button to create a new one.
NOTE: This will only work if you have permission to create Mural boards in the Room you selected. A known limitation of this app is that it can’t know if you’re allowed to create Murals in a given Room. It only knows that you have access to the Room, not the specific permissions you have within that Room.
If “Create New Mural” doesn’t work, it will return a message saying something similar to this: “403: Forbidden. You don’t have permission to create Murals in this Room.”
In that case, you’ll need to select a different Room via the dropdown. Or you’ll need to request or grant yourself permission to create Murals in the Room you selected.
“Create New Mural” will give you the ability to name your new Mural board, and once you’ve done that and clicked “Create,” the Skyline Builder interface will open, with your new Mural board already selected.
4. Generate your Skyline
4a. Adding data files
Currently, the app supports Excel files (.xlsx or .xls), Comma-Separated Values (CSV) files (.csv), and Google Sheets. Here are example files to show the formatting the app expects:
Example Excel Skyline data & Thinking Style Colors file
Example CSV Skyline data file
Example CSV Thinking Style Colors file
Selecting your Data Source:
You can either upload a file or files you have saved locally (see above for supported formats) or connect to your Google Drive to access your saved Google Sheets and use a Google Sheet as the Data Source.
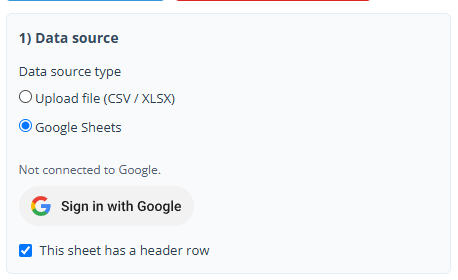
Using a Google Sheet as the data source:
If you would like to use a Google Sheet directly from your Google Drive files, you will need to use the “Sign in with Google” button to sign into your Google account and authorize the app to access your Drive. See the full Privacy Policy here for details of what we access and why.
Once you authorize the app, you will see a Dropdown field populated with a list of all Google Sheets accessible through the selected Google account.
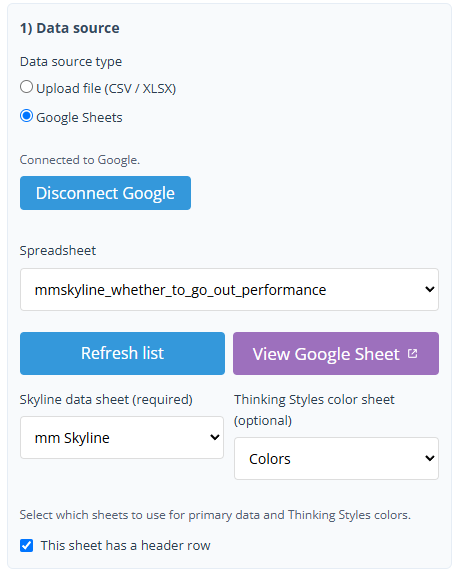
The “Disconnect Google” button will simply disconnect the app from your Google account.
Once the Spreadsheet dropdown has been populated (this may take a second or two), you can use it to select a source sheet to use for generating a Mental Model Skyline.
The “View Google Sheet” button will open the sheet in a new tab if you need to review or update the data there. “Refresh List” will refresh the list of available Google Sheets if you just created a new one that’s not already on the list.
Once you’ve selected a sheet to use as the Data Source, you will then be able to select a tab within that sheet to use for the Skyline data, and optionally select a different tab to use for the Thinking Styles colors.
After you’ve selected tabs to use as the data sources, you can proceed to the next part of the generation process.
Using a saved file as the data source:
You can use the two file upload zones (pictured below) to upload your Skyline data file and an optional Thinking Style colors file. If you opt to use the Excel file format, you can include the Thinking Style colors in another sheet in the same file.
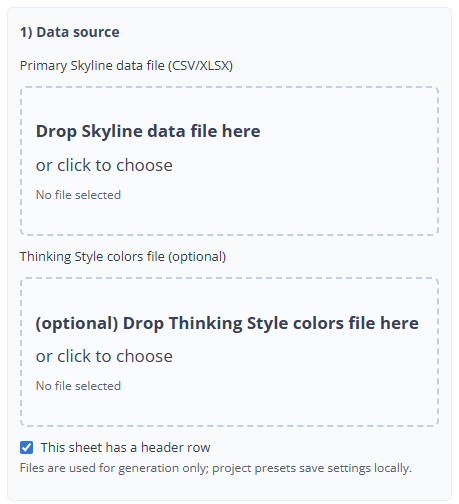
Both file upload zones allow you to drag and drop a file from your computer onto the zone to upload, or you can click on the zone to open your browser’s “file picker” menu and choose a file that way.
If you are using an Excel file as the data source, you can also select which Sheet within the Excel Workbook to use for the Skyline data and which to use for the Thinking Style colors (if any). The dropdowns for these options appear immediately below the Thinking Style colors upload area.
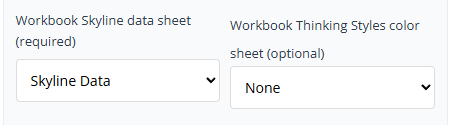
The other option in this area is a checkbox for “This sheet has a header row.” This option tells the app whether there is a header row with named columns at the top of the sheet, so it knows to skip the first row when reading the skyline data. You can uncheck this box if your spreadsheet has no header row.
4b. Mapping data sheet columns
There are two ways you can map data sheet columns to the visual “structures” in your Mental Model Skyline. The types of structures, from highest level to lowest level, are:
- Neighborhoods – collections of Blocks
- Blocks – collections of Towers
- Towers – collections of Summaries
- Summaries – text of the summaries in your Skyline data
The first way to map columns is just to allow the app to use columns 1 – 5 in your spreadsheet, with column 1 being the names of Neighborhoods, 2 being the names of Blocks, etc, with column 5 assumed to be the IDs associated with your Thinking Style colors (this column is optional).
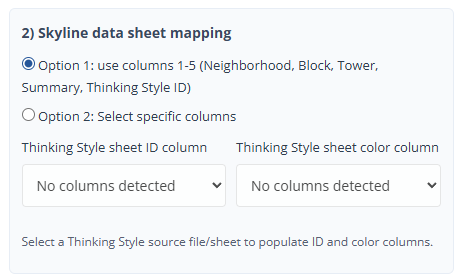
The second way to map columns is to select specific columns. If you choose this option, the app will read the header row (or the column numbers if there is no header row) and allow you to specify which column corresponds to each Skyline structure type via dropdown menus.

If you are using a Thinking Style colors sheet, you can also select the columns in that sheet to use for IDs and Colors.

4c. Layout and color settings

In this part of the Skyline Builder, you can define the maximum height of Towers and customize the background and font colors for the different Skyline structures.
The number in the “Maximum height of towers” field defines how tall a tower will be in terms of the number of summaries. For instance, if the maximum height is set to 5 (the default value), Towers that have more than 5 Summaries in them will become wider to accommodate a second stack of Summaries.
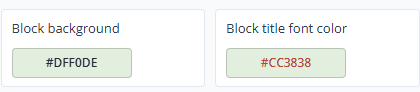
Below the “Maximum height of towers” setting are the color settings for the different Skyline structures. You can use the buttons there to set background and font colors for each structure as desired. Clicking any of the buttons will open your browser’s “color picker” interface (shown below) so you can select a color from the palette.
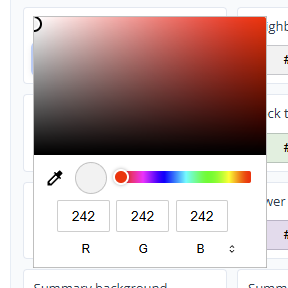
If you’re using a Chrome-based browser (Google Chrome, Microsoft Edge, Brave), your color picker will look something like the screenshot above. You can pick a color visually, or paste color values you’ve pre-selected. You can change the color type from RGB to Hex if needed by clicking on the letters/little arrows under the color value inputs:

If you change a structure’s background color with the buttons on the left, that color will also become the background for the font color buttons, so that you can see how your chosen font color will read against your chosen background color.
Choosing a font color for a structure will update the font color shown on that button.
Note that if you have included Thinking Style colors data in your data sources, those colors will become the background colors for the Summaries, and will override the background color you choose for Summaries in this section of the settings.
If you do pick a Summary background color, however, that color will become the default background color for any Summaries that do not have an assigned Thinking Style ID or associated color.
You can choose a Summary font color regardless of whether you’ve provided Thinking Styles colors.
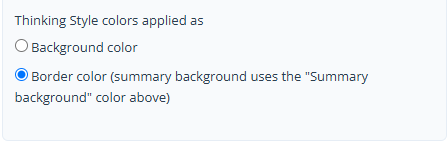
At the bottom of the “Layout and color settings” area, you can also choose whether to use any Thinking Styles colors you’ve provided as the Summary’s background color or as a border color. If you choose border color, then the Summaries will have the background color you select with the buttons above this area.
4d. Saving your project
Below the layout and color selection area, you can save your current project settings. Saving your settings uses your browser’s local storage to retain information about your project, such as your Skyline data (parsed from your uploaded documents and saved as compressed JSON), your column settings, and your chosen colors and maximum tower height.
If you haven’t selected a saved project, you will see the “Save project settings” button in the “Save settings (optional)” area. Clicking that button lets you specify a name for your project, then save it. The name will default to the name of the Skyline data document you uploaded, so you can use that if you don’t want to enter a specific name for the project.
Once you have one or more saved projects, you can load them via the “Saved project” dropdown at the top of the Skyline Builder interface (shown below).
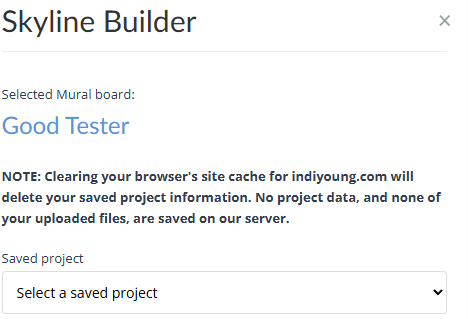
If you have selected a saved project in the dropdown, you will see two buttons in the “Save settings” area:
- “Save project settings” will overwrite the current saved project with the new settings you’ve selected
- “Save as new project” lets you create a new project with a new name and your current project settings
Additional project options display immediately below the “Saved project” dropdown when you have a saved project selected.
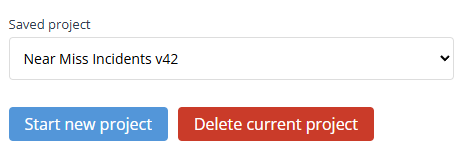
The “Start new project” button resets project settings to their defaults, without affecting your current saved project.
The “Delete current project” button removes your currently-selected saved project from your browser’s storage, deleting all associated settings and data.
4e. Analyze your data and/or generate your Skyline
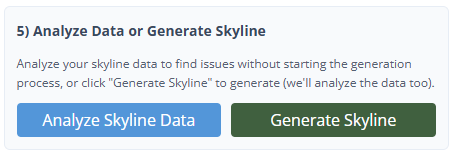
There are two options in this section: “Analyze Skyline Data” and “Generate Skyline.”
Analyze Skyline Data is an optional, helpful tool for identifying potential issues in your Skyline data sheet before you begin the longer generation process. It’s very quick (typically under 1 second) and will provide specific information about any issues it finds in the Skyline data sheet.
Issues that the analysis calls out:
- Empty structures, like Neighborhoods, Blocks, and/or Towers that have no associated Summaries
- Summaries with no associated Thinking Style color ID, or with a Thinking Style color ID that doesn’t match any of the list of IDs that you’ve provided
Note that Thinking Style color-related warnings will only display if you’ve provided Thinking Style colors data, either by selecting a Workbook sheet in an Excel file or by uploading a CSV containing Thinking Style colors data.
You do not need to use the “Analyze Skyline Data” tool in order to generate your Skyline. If you want, you can click “Generate Skyline” immediately to begin the generation process.
Clicking “Generate Skyline” will provide you with the same data sheet analysis that “Analyze Skyline Data” does, but it also immediately starts generating your Skyline in your selected Mural board.
The generation process may take a minute or two, depending on the number of Neighborhoods, Blocks, and Towers you have. This is due to limitations of the Mural API and the way the various Mural widgets must be created.
During the generation process, you’ll see a progress bar showing you when each Neighborhood has finished generating. If you wish, you can also open the Mural board you’re using to watch the generation in real time.
Once generation is complete, an “Open Mural” button will become visible, allowing you to open your selected Mural board in a new browser tab to inspect the results.
Happy generating!
5. Data privacy
The key note here is that at no point does the Skyline Builder app retain any of your data on our server. All data, including Mural login information, user details like Mural username, and all uploaded Skyline data, are retained ONLY in your browser’s local storage.
What that means is that all saved project data exists only on your hard drive, not on the indiyoung.com server. You can delete all of this saved data at any time by clearing your browser’s cache for indiyoung.com.
IMPORTANT: If you fully clear your browser’s cache at any point, your saved project data will be lost.
We do it this way for two main reasons:
- Privacy: We never see or store any of the personal or professional data associated with your use of this app.
- Storage: We have limited storage capacity on our web server and cannot allocate space to saved data files.
Please enjoy using the Mural Mental Model Skyline Generator! If you have any questions or discover any issues with the app, please reach out to us here.
6. Terms of Use
The Mental Model Skyline Generator uses SheetsJS for excel and csv spreadsheet parsing.
Google Drive and Google Sheets are trademarks of Google LLC.